

I've received a number of requests for this particular document, so I'm giving it a page of its own to link to it more easily and with more detail than the other samples. If you're in a hurry and just want the document, read the disclaimer below, then click the image to download the .xlsx file.
If you're totally not in a hurry and want to read the instructions/case study of how this calculator came to be, there's a link to that further down.
By downloading this document you are accepting any and all risks and outcomes associated with it. Anything that happens or doesn't happen is on you.
It comes with some sample placeholder data to give you an idea of what goes where, which you must replace with your own data.
Once you have downloaded it, it's yours to do with as you wish. You can see all the formulas, change your copy how ever you like, repost it, do as you please because it's all yours (And Microsoft's since it's an Excel sheet; but feel free to redo the thing in your spreadsheet tool of choice).
It absolutely does not in any way guarantee any revenue, new deals, new leads, new friends, or anything else; it just gives you some nested, basic formulas correlating a lot of cost and revenue data, some of it also speculative, to tell you what the results of those calculations are, and thus, what the outcome of the event is likely to be based on your own inputs. The formulas themselves are visible by selecting a given cell with a formula.
I designed this calculator over the course of 6 years for use inside our Marketing Services company (PaydayPERX) to help leadership decide which of the virtually infinite number of digital marketing conferences to choose with our very finite and critically important events budget. I knew that there had to be better indicators than gut feelings or just listening to salespeople claiming 'We have to be there' (or conversely, 'This is a waste of time'). Not that they were wrong at all, but that there had to be an objective way to capture WHY we had to be there, or should never waste our time/money on it. It grew over time to multiple tabs to capture expenses and critical logistics information, and included a small 'dayplanner' aspect for salespeople/attendees to have everything all in one place, meetings and goals, to keep with them during the show.
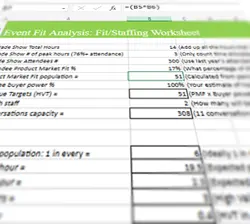
By replacing the placeholders/adding YOUR costs and data regarding market fit of the audience, buying power of the audience, the length of your sales cycle, average size of deals, various expenses and the amount of time (in hours) the tradeshow operates, etc, it can bring insights to help identify better shows to exhibit at and/or sponsor.
I hope you will download it, page through the tabs and see how it works, and gain a benefit from using these sheets to decide how many staffers to send, how much useless traffic you're likely to get and need to filter out quickly to find the 'good' traffic, whether it's worth getting that masseuse or magician to fill your booth with people or should instead be targeted and selective.
(And if you need a masseuse or a magician, I can give you recommendations for either one. They virtually guarantee your booth will be stuffed with visitors - Great for a show with high market fit, bad at a show where most of the people can't buy and don't care about your solution).
Tradeshows aren't really a thing I'm very involved with any more, so I'm not planning on creating instructions or a helpfile/how to video series/etc unless the demand for it is there; but from experience I also know that a few of the cells don't work the way you might expect. Feel free to contact me if you have any specific questions and I'll walk you through how it's supposed to work.
Site built by Monica Bower.
Contents, samples and collateral © 2012-2025 Monica Bower and/or their respective owners and used with permission. Images created by Monica Bower. Images are free to use under CC-SA-BY. Find out more about the site on About Me.
Candy, Popcorn and Space Adventures - meet my toplevel domain on Galaxy Sweet