
If this whole marketing thing hadn't worked out, I would have liked to be a mathematician. The comfort of the proof of numbers is profound. Every complex structure that exists in reality can be represented mathematically - as well as an infinite set of structures MORE complex than reality, like the thousand-plus dimensional vectors used routinely by AI models in 2026.
And while anyone (almost anyone) can create a simple revenue spreadsheet in Excel or a leads funnel dashboard in Salesforce, there are more interesting things to be seen when you look at the relationships between qualitative and quantitative data, especially with the application of data science principles. Even relatively simple analytic formulas applied to things that normally aren't analyzed that way can produce surprising results (Like applying the Copernican Principle to the long tail of an existing product lifecycle).
Here's a simple filter applied to interesting data. PaydayPERX is one of the largest independent providers of OFX data to tax preparer companies - when you click the 'import my W-2' button if you're doing your taxes online, PERX is one of a handful of companies routing the data to those requests from Payroll and Employer partners. This request-response-result process creates a lot of metadata, normally used only for automated billing and uptime monitoring.
Running that dataset through Tableau provided an interesting look at which company's employees were using Ww-2 auto-import the most, without ever involving the employees' actual data - just the number of requests to the network and the EIN of their origin. It also allowed us to visualize the nature of the requests - the ones from self-service taxpayers filing online, compared to those requested by the brick-and-mortar office when people come in to have their taxes done for them at H&R Block.
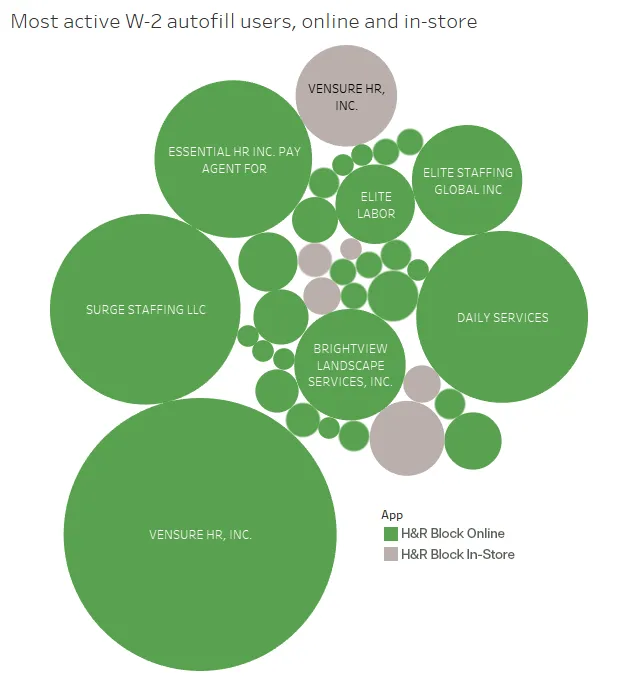
The size of the circle shows the absolute scale, and the color shows the requesting application - green for online requests and gray for an in-store request, meaning this person went to an office and then the staff there used auto-import to bring in their W-2 data.
Even though the data is absolute (meaning the size of the employer is not part of the equation, just the unadjusted number of downloads) the largest participants in the program are not the largest employers in the program. Armed with this data it was much easier to both champion an awareness campaign and to work with the individual employers to ensure their employees realized they had the option.
The other interesting factor is that auto-import can be done anytime after January 15 of a given year, when the actual W-2 may not be in hand for several weeks after that date; filing sooner means getting your refund that much sooner, an obvious benefit for staffing and day-labor workers using the feature.
Site built by Monica Bower.
Contents, samples and collateral © 2012-2026 Monica Bower and/or their respective owners and used with permission. Images created by Monica Bower. Images are free to use under CC-SA-BY. Find out more about the site on About Me.
Candy, Popcorn and Space Adventures - meet my toplevel domain on Galaxy Sweet